Release Note April 2024
Connect with CSSI
Follow CSSI Solutions on LinkedIn for updates on Portal+, reporting workflows, cloud hosting, APX and Axys support, and investment operations.
Report Updates
- New Report – Portfolio Performance Executive Summary
- Shows portfolio or group’s internal rate of return and activity during a specified period. The report includes beginning market value, contributions, withdrawals, realized and unrealized gains, income, and ending market value. Report also contains a bar graph of TWR for selected periods. The report can run with a gross of fees or net of fees option in a single currency, US Dollar.
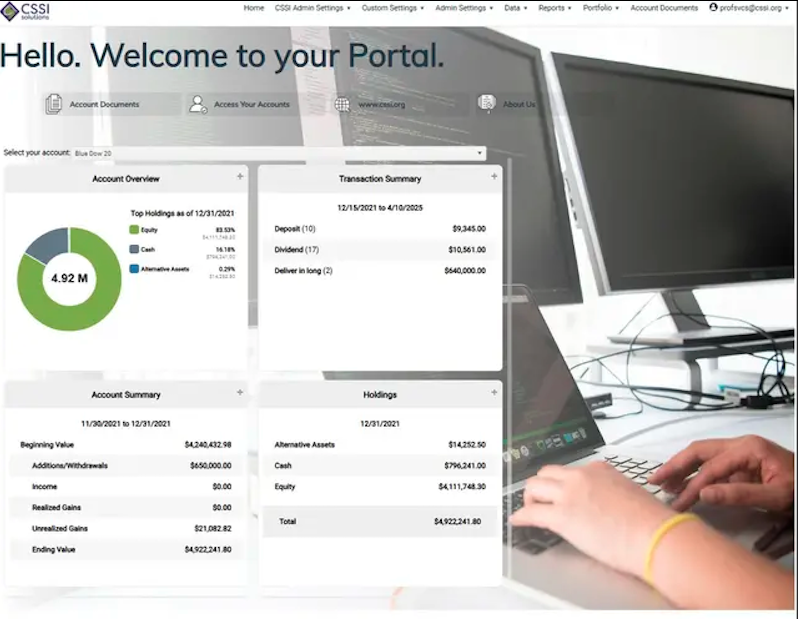
- New Report – Target Allocation Overview
- Displays a base and a model portfolio’s holdings as pie charts, visually representing the composition of assets. Below, a table compares the percentages of the two portfolios. This report can be run on three different grouping levels: Asset Class, Industry Group or Sector in a single currency, US Dollar. Report contains unsupervised feature with the ability to separate supervised from unsupervised assets.
Related CSSI service paths
APX SSRS reporting support
Operational support for recurring APX SSRS output, packaging rules, and delivery exceptions.
SSRS reporting for financial services
Custom SSRS report development for household, portfolio, performance, and risk reporting.
Investment client reporting portal
Secure report packages, document vault access, dashboards, and repeatable client delivery workflows.
Secure document vault for RIAs
A controlled client document retrieval workflow for firms moving sensitive files out of email.